Key Data
The Key Data view is another way to investigate the form.
As you can see in the example below, using the dropdown menu in the middle, we can compare all of the runners by one central metric. And we can analyse that across their last 10 runs.
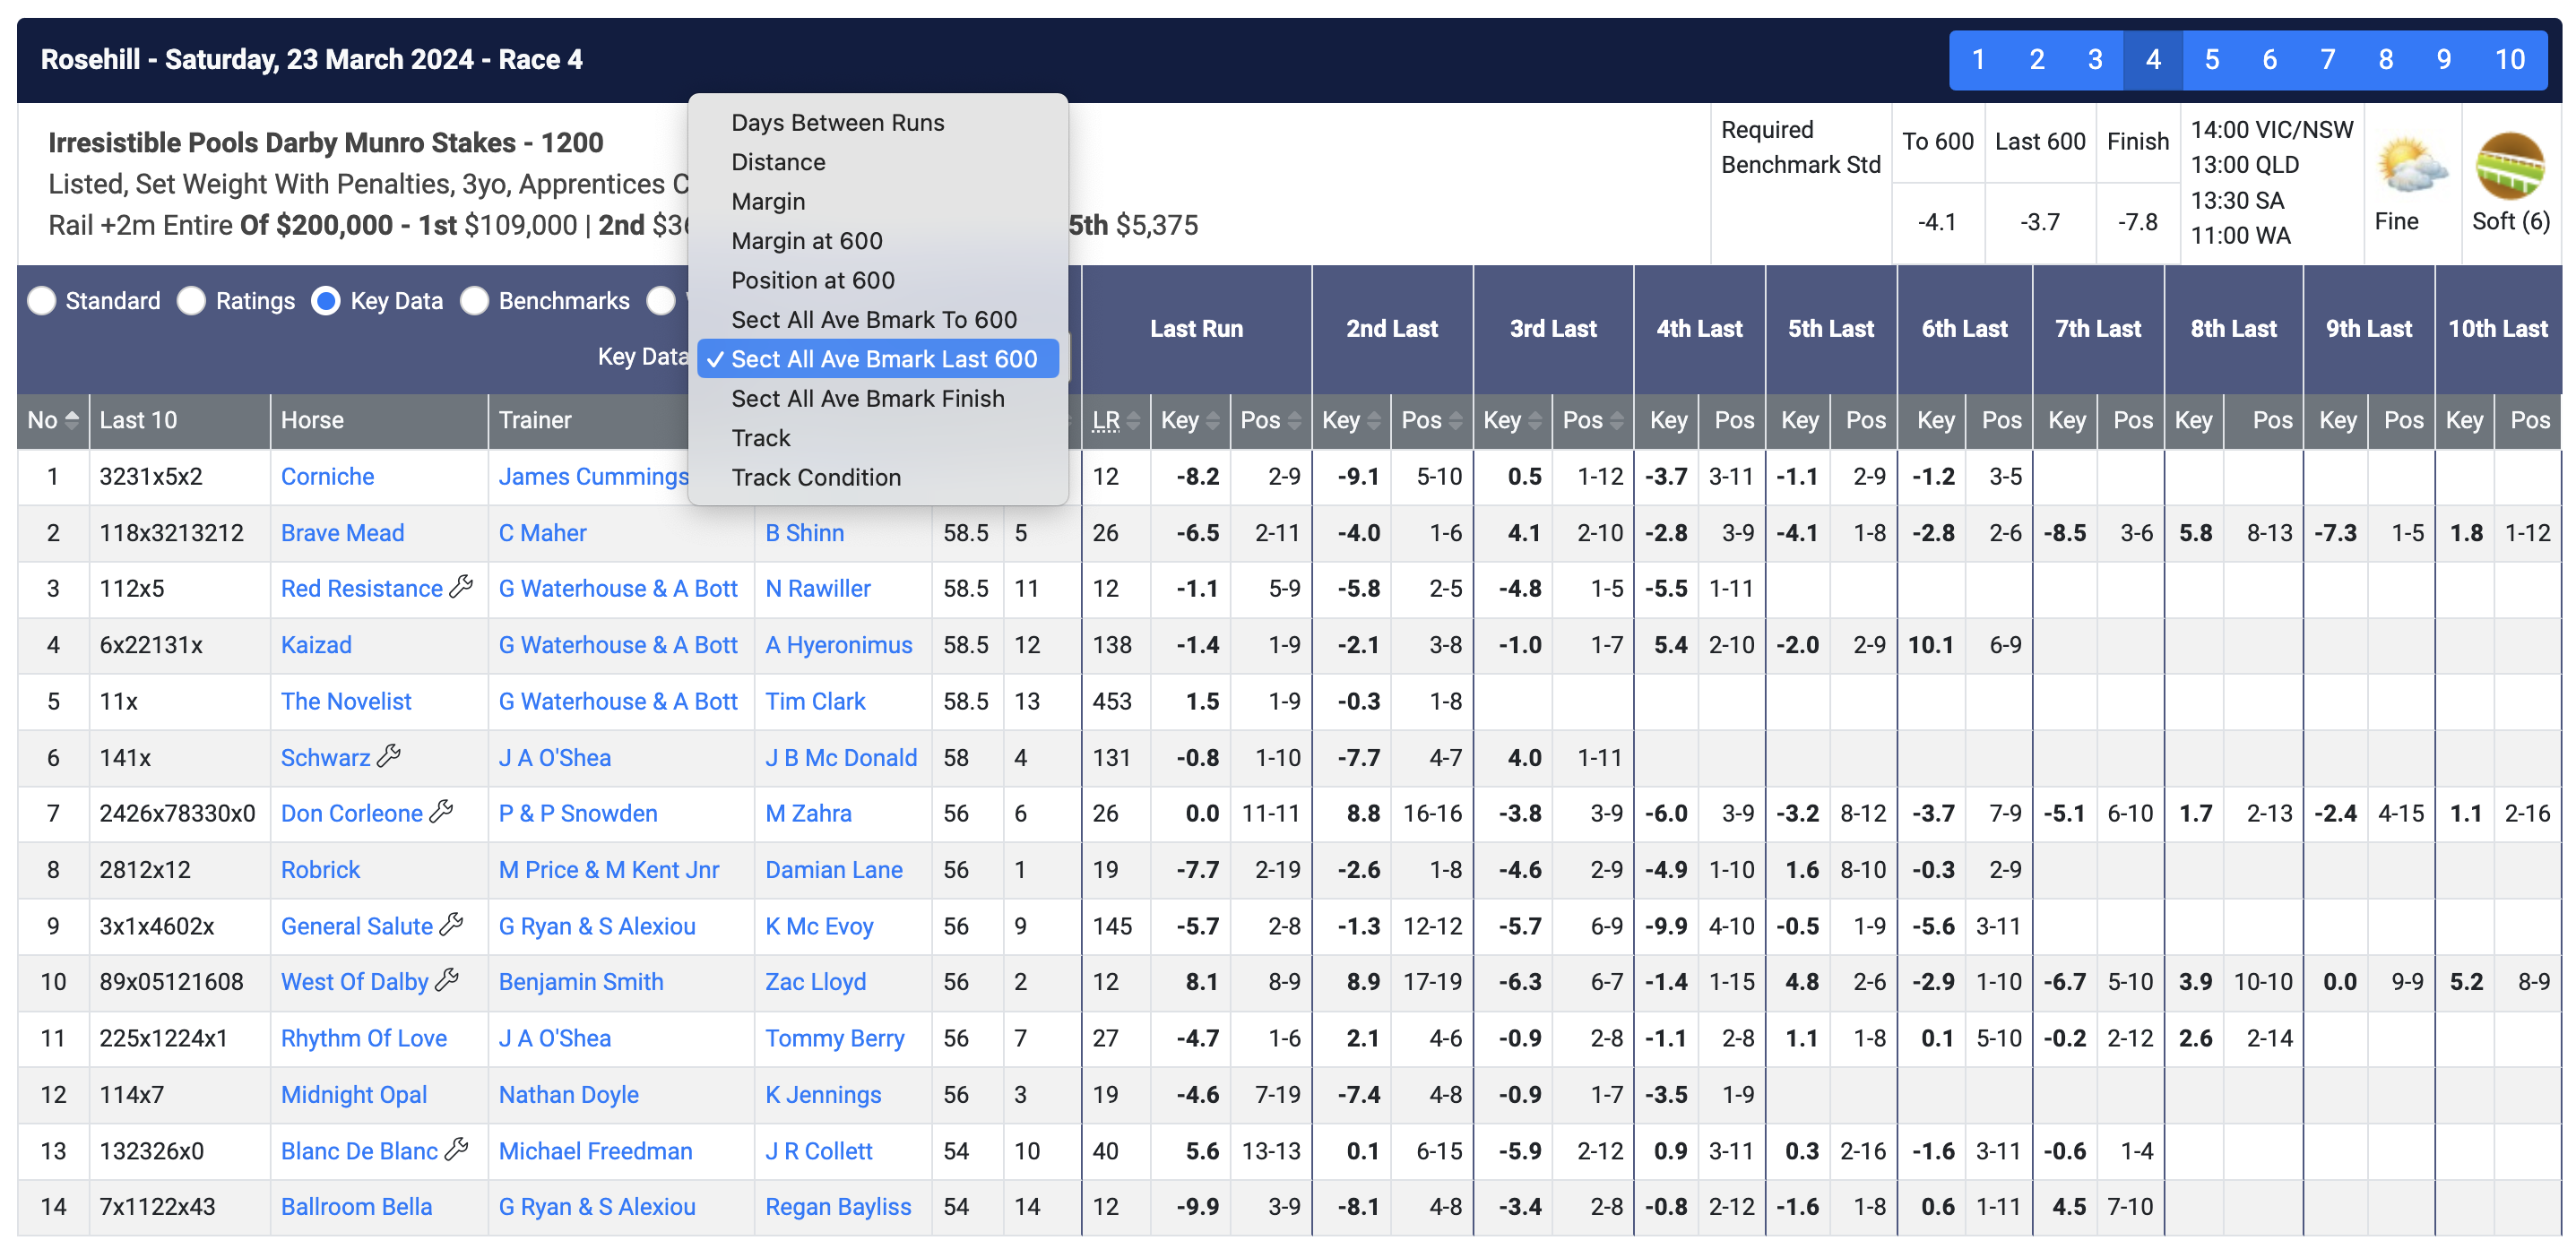
Looking at this race over 1200m in Sydney we might want to compare their last 600m performances. Who comes home consistently strong, and how are they valued by the market?
Or do you forgive certain performances because you recall what happened? For example, Corniche's last two runs had exceptional last 600m benchmarks but the 3rd last run was poor. So can we forgive that run and anticipate an electric Corniche finish, based on the Punting Form Speed Map and complimentary data?
Updated 11 months ago
What’s Next
Did this page help you?